Summary of DNA methylation analysis
A brief summary of our DNA methylation analysis.
RRBS
We used RRBS (reduced representation bisulfite sequencing) to analyse the DNA methylation profiles affected by our experimental feed with different micronutrient compositions. RRBS utilises restriction enzymes to target CpG rich regions in the genome. We used two different enzymes for our RRBS analysis.
Restriction enzymes used for RRBS
- MspI (recognition sequence :
5' CCGG) - TaqI (recognition sequence :
5' TCGA)
RRBS samples
We collected 9 male gonad samples at the final harvest stage for RRBS sequencing.
The number of samples for each group
- L1 diet: 3 samples
- L2 diet: 3 samples
- L3 diet: 3 samples
| No | Name | Diet | Sex |
|---|---|---|---|
| G11 | L1 | M | |
| G24 | L1 | M | |
| G41 | L1 | M | |
| G1 | L2 | M | |
| G18 | L2 | M | |
| G31 | L2 | M | |
| G26 | L3 | M | |
| G27 | L3 | M | |
| G40 | L3 | M |
Definition of genomic regions
Functions of DNA methylation can be different depending on the types of regions where methylation occurs. We split the genome into seven different regions for our RRBS analysis.
Genomic regions for RRBS read mapping
- Exon
- Intron
- P250 (proximal promoter)
- P1K (promoter)
- P5K (distal promoter)
- Flanks (potential enhancer region)
- IGR (intergenic region)

Bioinformatics pipelne for RRBS
We used various bioinformatics algorithms and methods to analyse our RRBS samples. The following tools were those we used in our main RRBS pipeline.
- FastQC (quality control)
- Trim Galore! (adapter trimming)
- MultiQC (quality control report)
- Bismark (read alignment)
- methylKit (differential methylation analysis)
Results
Overall diet effect
Clustering analysis showed no clear overall diet effects on the male gonad samples.

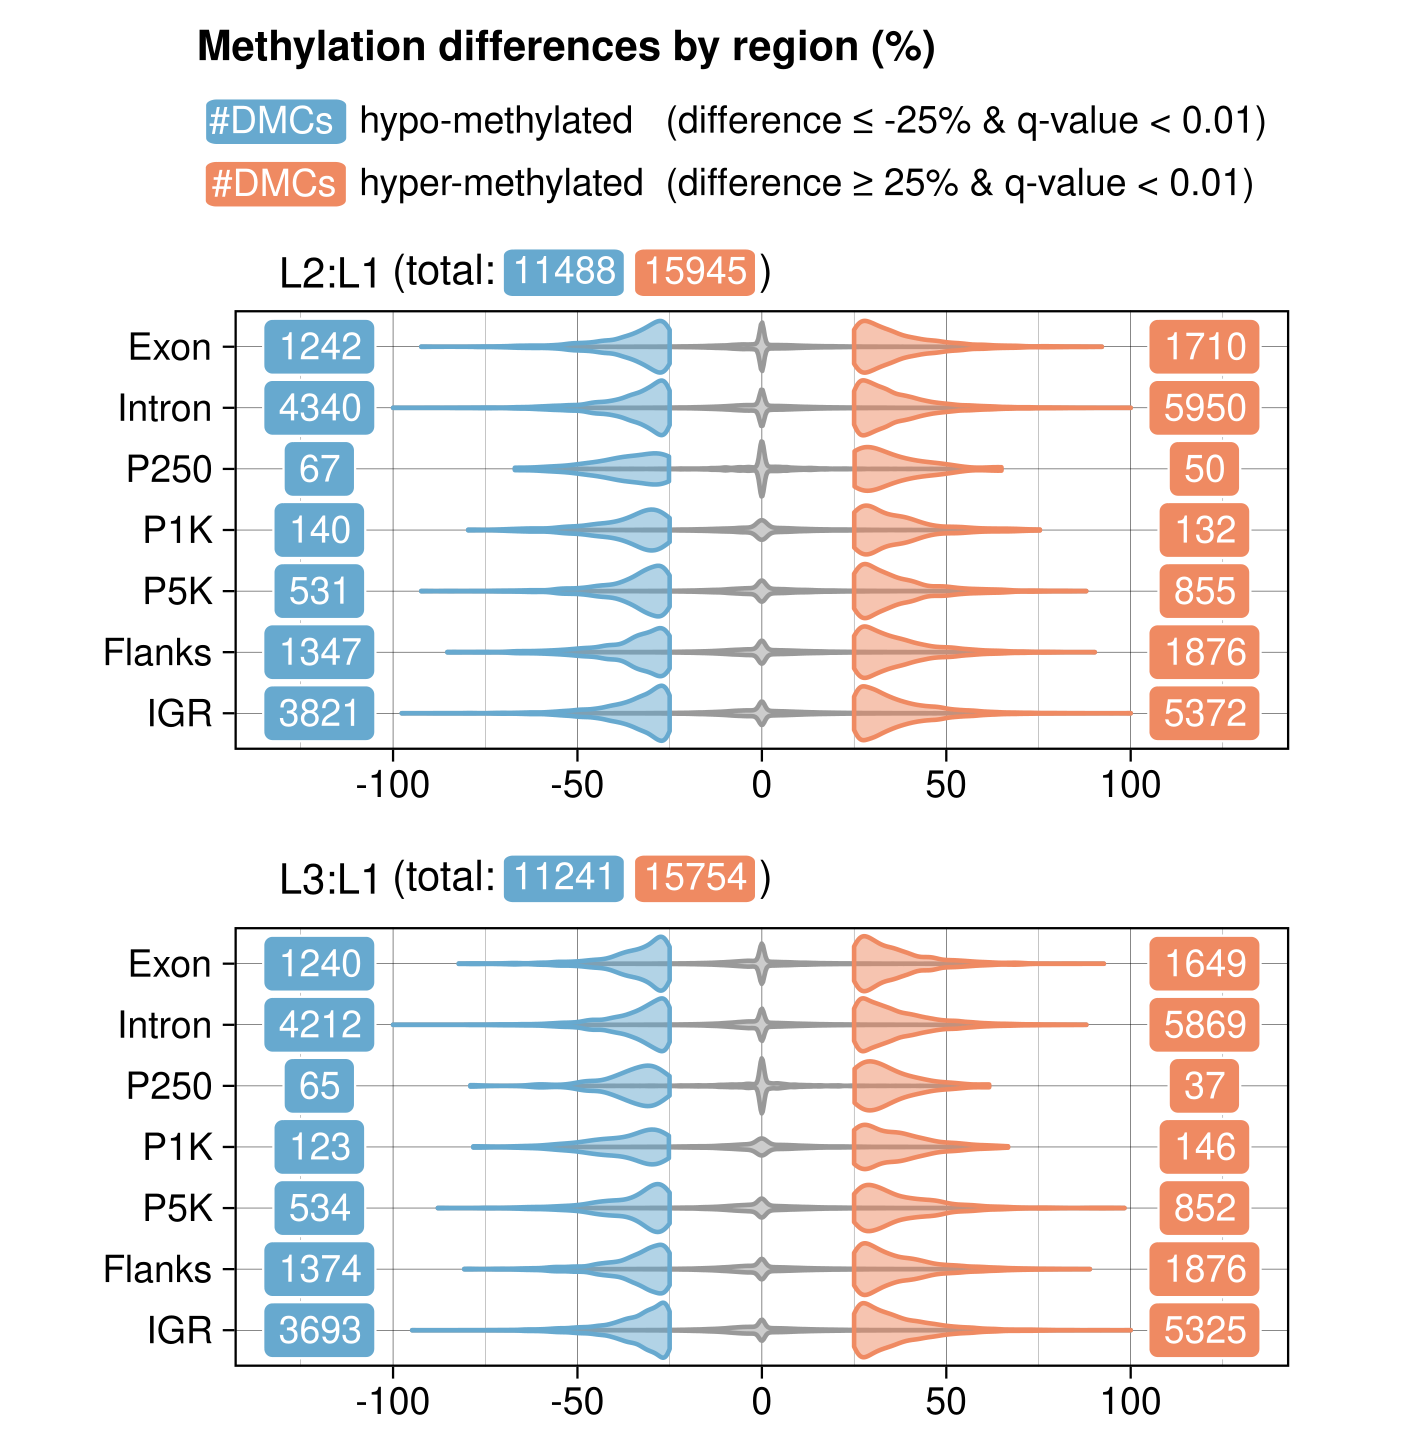
Differentially methylated CpG sites
There were no noticeable differences between L2:L1 and L3:L1 as well as hypo- and hyper-methylation in terms of the number of DMCs.
Identified DMCs for L2:L1 and L3:L1
- L2 vs. L1: 27433 DMCs
- L3 vs. L1: 26995 DMCs
See What are DMCs? for more details about DMCs.
Significantly affected biological pathways
ORA (over representation analysis) on KEGG (Kyoto Encyclopedia of Genes and Genomes) pathways showed that micronutrient supplement significantly affected DNA methylation profiles in various pathways mainly through DNA methylation in their gene bodies.
| Pathway | KEGG ID | L2L1 | L3L1 |
|---|---|---|---|
| Purine metabolism | sasa00230 | - | Gene body (65/1898) |
| Lysine degradation | sasa00310 | - | Exon (15/545) |
| Mucin type O-glycan biosynthesis | sasa00512 | P+GB (25/2311) | - |
| Various types of N-glycan biosynthesis | sasa00513 | Gene body (25/1958), Intron (23/1516) | Intron (24/1490) |
| Other types of O-glycan biosynthesis | sasa00514 | RS+GB (38/2818), P+GB (32/2311), Gene body (27/1958) | - |
| Glycosaminoglycan biosynthesis - heparan sulfate / heparin | sasa00534 | RS+GB (29/2818), P+GB (28/2311), Gene body (26/1958), Intron (24/1516) | RS+GB (31/2725), P+GB (27/2219), Gene body (25/1898), Intron (22/1490) |
| Glycerolipid metabolism | sasa00561 | RS+GB (43/2818), P+GB (37/2311), Gene body (31/1958) | - |
| Inositol phosphate metabolism | sasa00562 | RS+GB (55/2818), Gene body (42/1958) | - |
| ErbB signaling pathway | sasa04012 | RS+GB (83/2818), P+GB (73/2311), Gene body (66/1958), Intron (59/1516) | RS+GB (78/2725), P+GB (65/2219), Gene body (61/1898), Intron (54/1490) |
| Phosphatidylinositol signaling system | sasa04070 | RS+GB (70/2818), P+GB (62/2311), Gene body (58/1958), Intron (47/1516) | - |
| Cellular senescence | sasa04218 | P5K (25/357) | - |
| Adrenergic signaling in cardiomyocytes | sasa04261 | RS+GB (160/2818), P+GB (139/2311), Gene body (122/1958), Intron (104/1516) | RS+GB (133/2725), P+GB (118/2219), Gene body (103/1898), Intron (83/1490) |
| Vascular smooth muscle contraction | sasa04270 | RS+GB (89/2818), P+GB (76/2311), Gene body (66/1958) | - |
| Wnt signaling pathway | sasa04310 | RS+GB (129/2818), P+GB (112/2311), Gene body (98/1958) | RS+GB (125/2725), P+GB (106/2219), Gene body (91/1898) |
| Apelin signaling pathway | sasa04371 | RS+GB (102/2818), P+GB (91/2311), Gene body (77/1958), Intron (64/1516) | - |
| ECM-receptor interaction | sasa04512 | RS+GB (78/2818), P+GB (70/2311), Gene body (63/1958), Exon (23/570), Intron (50/1516) | RS+GB (66/2725), P+GB (61/2219), Gene body (58/1898), Exon (23/545), Intron (42/1490) |
| Cell adhesion molecules | sasa04514 | P+GB (98/2311), Gene body (86/1958), Intron (72/1516) | P+GB (96/2219), Gene body (87/1898), Intron (73/1490) |
| Adherens junction | sasa04520 | RS+GB (87/2818), P+GB (77/2311), Gene body (72/1958), Exon (25/570), Intron (55/1516) | RS+GB (78/2725), P+GB (68/2219), Gene body (60/1898), Intron (49/1490) |
| Gap junction | sasa04540 | RS+GB (73/2818), P+GB (64/2311), Gene body (61/1958), Intron (45/1516) | - |
| Insulin signaling pathway | sasa04910 | P+GB (80/2311) | - |
| GnRH signaling pathway | sasa04912 | RS+GB (83/2818), P+GB (76/2311), Gene body (69/1958), Intron (57/1516) | Intron (47/1490) |
| Melanogenesis | sasa04916 | RS+GB (90/2818), P+GB (80/2311), Gene body (72/1958), Intron (53/1516) | - |
| Adipocytokine signaling pathway | sasa04920 | - | P+GB (49/2219), Intron (34/1490) |
Page links
Overview
DMC: differentially methylated CpG site
- What are DMCs?
- DMCs L2:L1 (top 100)
- DMCs L3:L1 (top 100)
- DMCs L2:L1 (full list)
- DMCs L3:L1 (full list)
DMG: differentially methylated gene
Leave a comment