What are DMCs?
DMC stands for differentially methylated CpG site. The difference of DNA methylation is statistically significant between treatment and control groups for each DMC.
Treatment and control groups
We used three groups - L1, L2 and L3 diets - to calculate DMCs. L1 diet was used as control.
Data sets for differential expression analysis
- L2:L1: L2 vs. L1 with using L1 as control
- L3:L1: L3 vs. L1 with using L1 as control
See Experimental feed for details about L1, L2 and L3 groups.
Statistical calculation
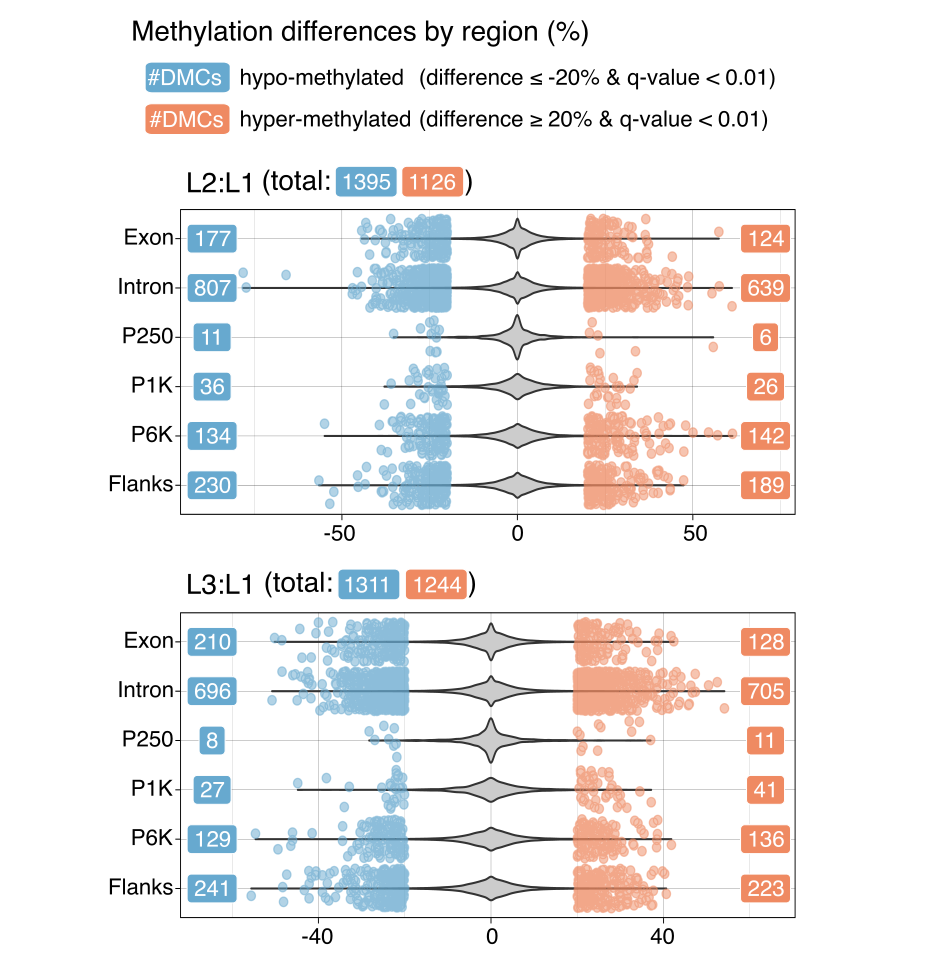
We used methylKit to calculate methylation differences (%) and q-values between treatment and control groups. Positive methylation differences indicate hyper-methylation, whereas negative methylation differences indicate hypo-methylation based on the L1 DNA methylation. We used the following criteria to define our DEGs.
abs(percentage methylation differences) >= 20%Q-value < 0.01
Differentially methylated CpG sites
There are no noticeable differences between L2:L1 and L3:L1 as well as hypo- and hyper-methylation in terms of the number of DMCs.
Identified DMCs for L2:L1 and L3:L1
- L2 vs. L1: 2521 DMCs
- L3 vs. L1: 2555 DMCs

Analysis of DMCs
We further analysed DMCs to understand the differences of DNA methylation profiles affected by micronutrients.
- Analysis of DNA profiles in different locations
- Linking with gene expression result
Leave a comment